Display issue with percentage in a chart
Solved
MariisaT
Posted messages
62
Status
Member
-
Raymond PENTIER Posted messages 58211 Registration date Status Contributor Last intervention -
Raymond PENTIER Posted messages 58211 Registration date Status Contributor Last intervention -
Hello,
After searching on the forum and the internet, I can't find a solution to this problem:
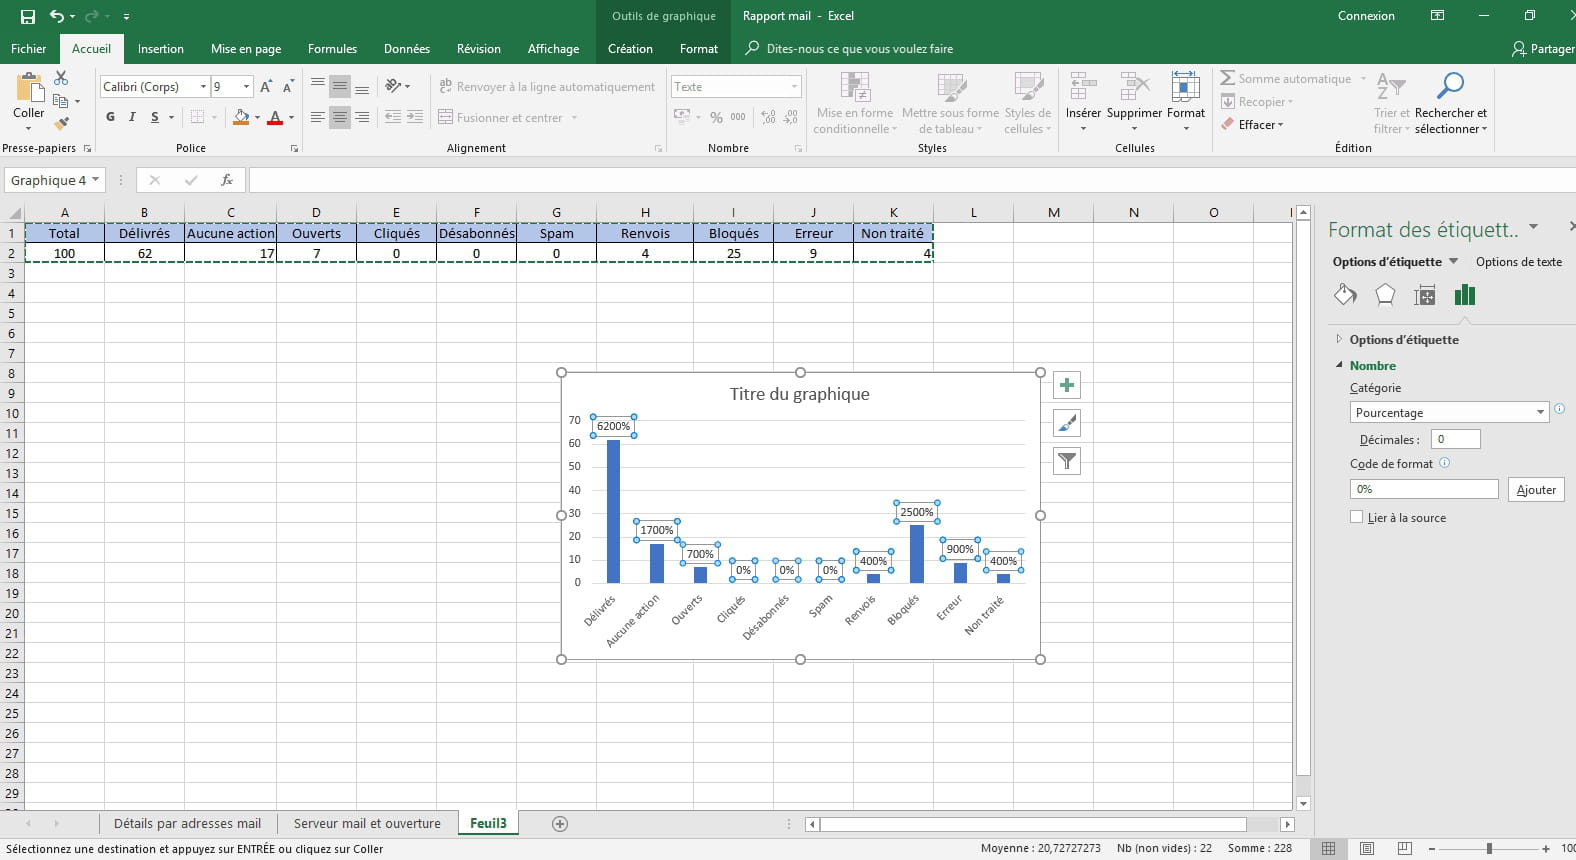
I have a chart where my percentages display incorrectly. Instead of showing 62%, it indicates 6200%.
I'm including a screenshot for better understanding of the issue.

Knowing that the numbers contained in the table should not be modified.
I am using Excel 2016, with decimal settings in the label options as well as in the data/data validation: accept decimal minimum: 0 maximum: 0.
Best regards.
After searching on the forum and the internet, I can't find a solution to this problem:
I have a chart where my percentages display incorrectly. Instead of showing 62%, it indicates 6200%.
I'm including a screenshot for better understanding of the issue.
Knowing that the numbers contained in the table should not be modified.
I am using Excel 2016, with decimal settings in the label options as well as in the data/data validation: accept decimal minimum: 0 maximum: 0.
Best regards.
3 answers
-
Hello MariisaT
You need to format the line containing the data in %
62 becomes .62, which is 62/100
the graph will display the correct value
In your Excel data source, it cannot know that it is a percentage, you display 62 for Excel, 62 becomes 6200
--
Practice makes perfect. - It is at the foot of the wall that one sees the mason - one always learns from their mistakes.