
Empty graphs Centreon
Solved
Hello,
I am currently getting to grips with Centreon (latest version, downloaded a week ago). I have a central server as well as a remote poller for testing. No issues on that front and this morning I was configuring the layout of the dashboards. All the widgets are functioning except for the "Graph Monitoring".
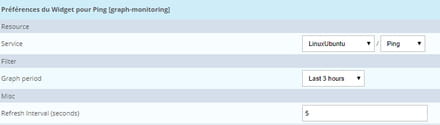
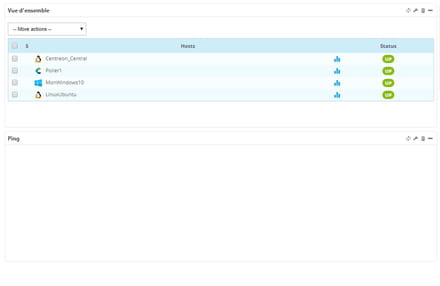
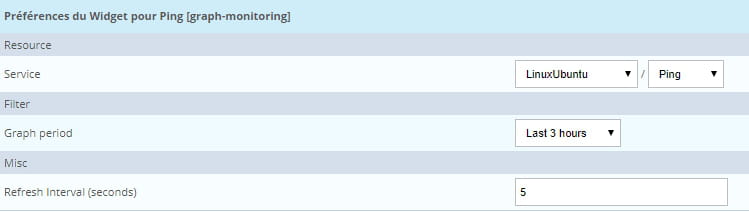
I added it, selected my host (an Ubuntu) and the service (here the PING). I confirmed the choices and even after reboot, I have no graph (the box is empty):
This results in:
Is there an action that I might have forgotten to perform? I rely quite a bit on the documentation or other tutorials and I don't see what I've missed.
Do you have any idea?
Thank you in advance,
I am currently getting to grips with Centreon (latest version, downloaded a week ago). I have a central server as well as a remote poller for testing. No issues on that front and this morning I was configuring the layout of the dashboards. All the widgets are functioning except for the "Graph Monitoring".
I added it, selected my host (an Ubuntu) and the service (here the PING). I confirmed the choices and even after reboot, I have no graph (the box is empty):
This results in:

Is there an action that I might have forgotten to perform? I rely quite a bit on the documentation or other tutorials and I don't see what I've missed.
Do you have any idea?
Thank you in advance,
1 answer

Hello,
I don't know Centreon, but apparently, it stores the data needed to plot graphs in rrd files. These files are presumably populated by various probes. Are they created, do they contain data?
https://forum.centreon.com/forum/centreon-collect/centreon-broker/143890-empty-graphs-after-restore-but-csv-export-shows-data
Good luck
it turns out that the data has been retrieved correctly, but the server is not synchronized, and the JS plugin that displays the graphs (which is on time since it synchronizes with the PC's time) is not showing the data. Unless we take a very large range above the offset.
Nothing too serious then,