
Chart: insert a fixed horizontal line
Solved
arno75011
Posted messages
11
Status
Membre
-
Nico -
Nico -
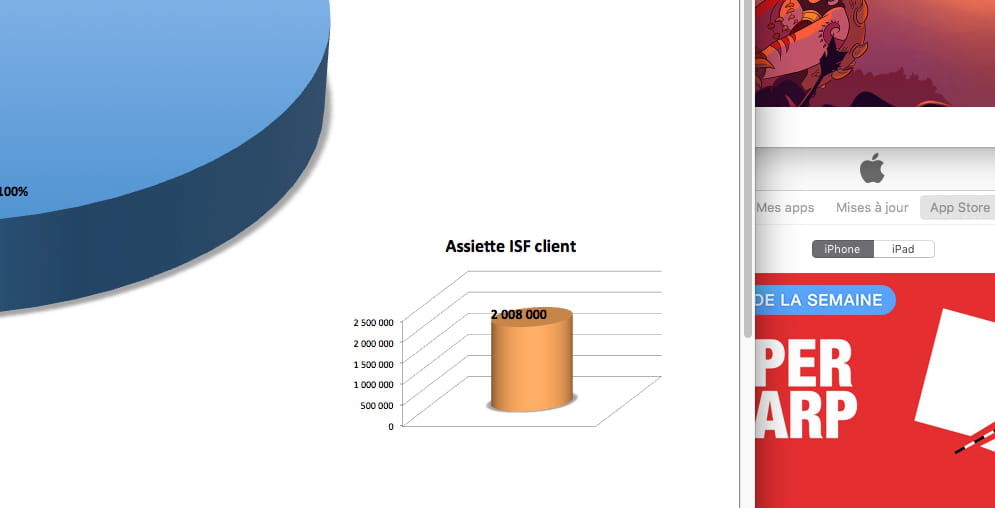
Hello, I would like to set a horizontal line at Y=1300000 that stays fixed while the orange column is variable. Thank you.
3 réponses
Good evening
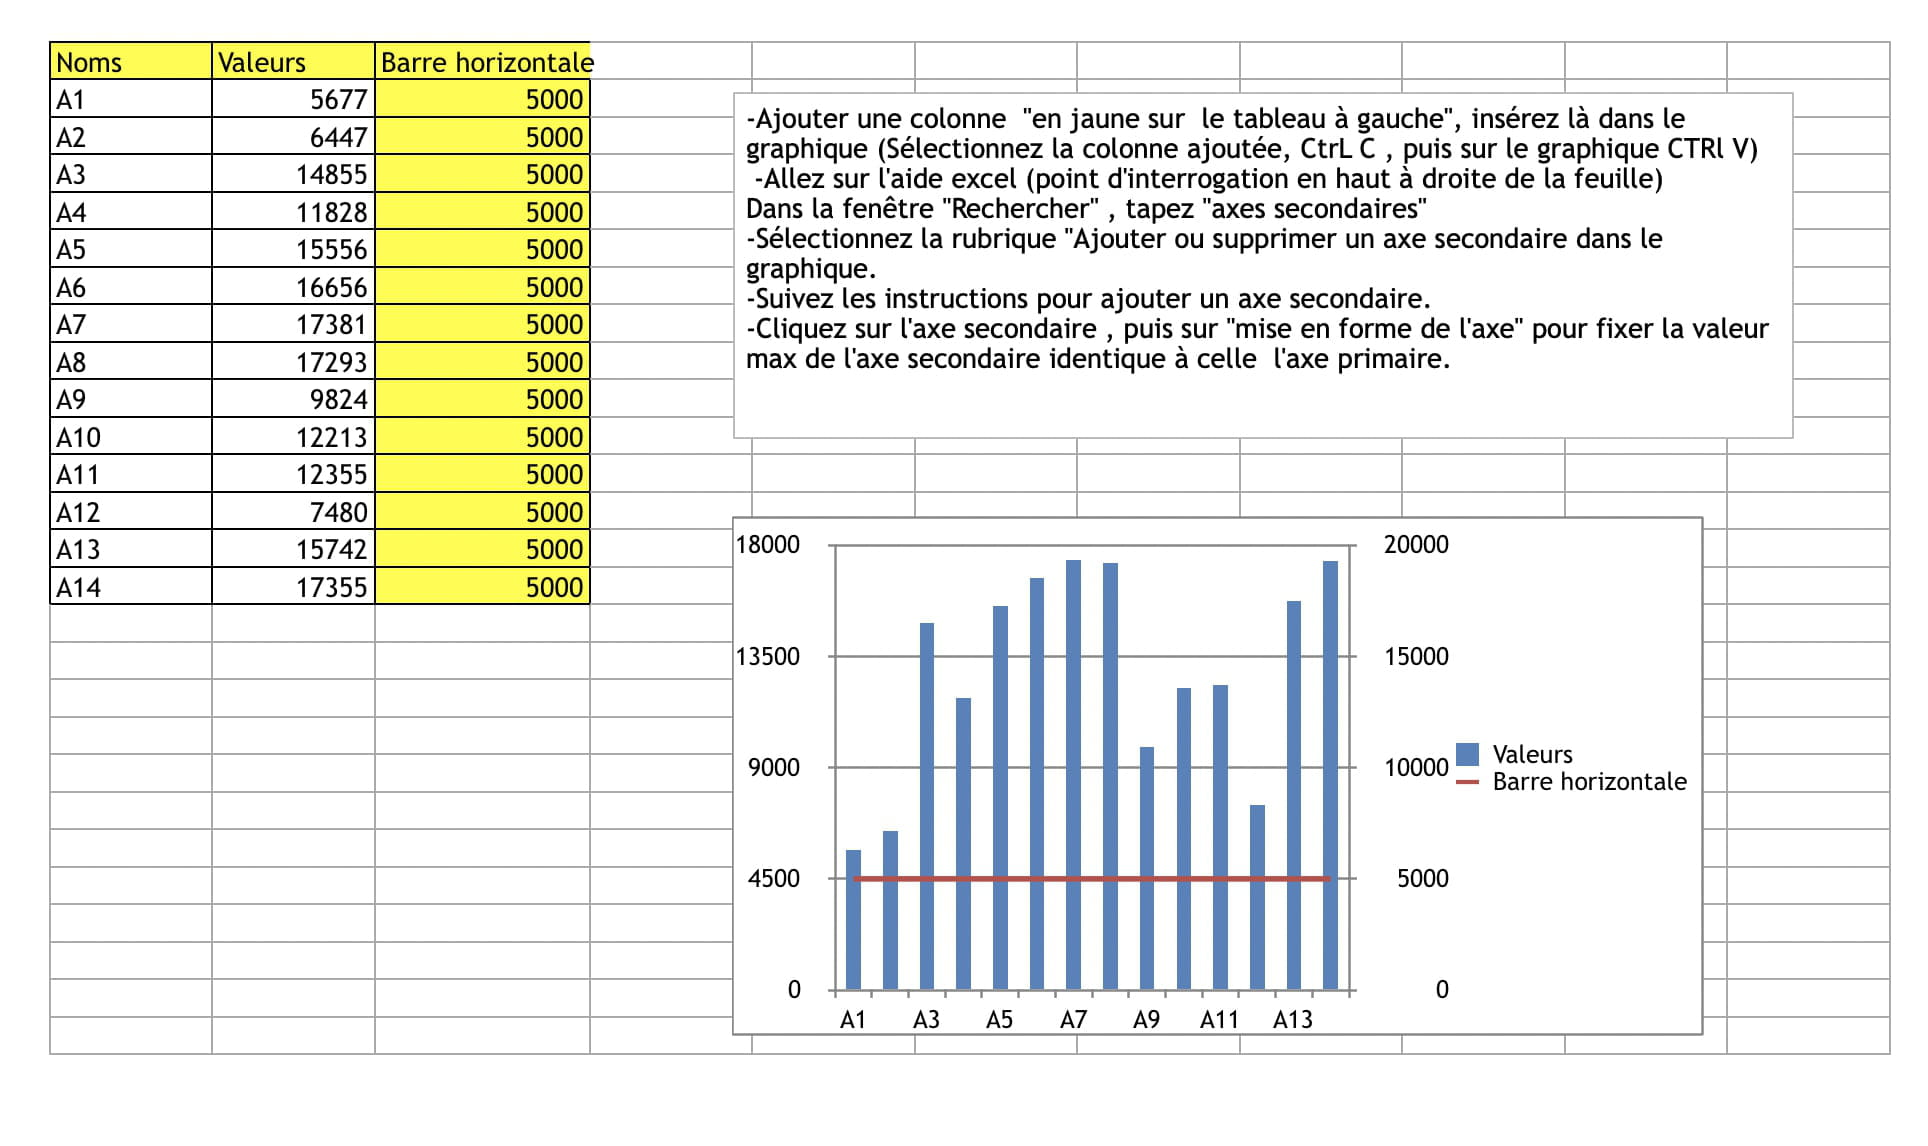
In the table, I added a column with a fixed value, then this column is integrated into the chart by copy-pasting.
Then, a secondary axis needs to be created for these new values and a "line" chart needs to be plotted.

Everything is explained in the attached file.
https://www.cjoint.com/c/FGptpn6ocnw
Best regards
In the table, I added a column with a fixed value, then this column is integrated into the chart by copy-pasting.
Then, a secondary axis needs to be created for these new values and a "line" chart needs to be plotted.
Everything is explained in the attached file.
https://www.cjoint.com/c/FGptpn6ocnw
Best regards
I thank you again for the time you are giving me
have a good weekend
Arnaud
It corresponds exactly to what I was looking for.
Nicolas