Incliner le texte sur un histogramme en php
Résolu
gahmed
Messages postés
79
Statut
Membre
-
gahmed Messages postés 79 Statut Membre -
gahmed Messages postés 79 Statut Membre -
Bonjour,
J'ai un problème avec mon histogramme, le texte sur l’abscisse se superpose voila ce que j'ai:
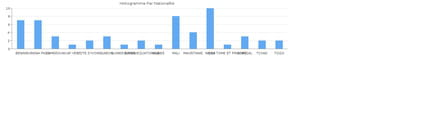
Maintenant je voudrai incliner le texte sur l'abscisse de mon histogramme.
Je travaille avec php et mysql voici mon script:
Merci d'avance
J'ai un problème avec mon histogramme, le texte sur l’abscisse se superpose voila ce que j'ai:

Maintenant je voudrai incliner le texte sur l'abscisse de mon histogramme.
Je travaille avec php et mysql voici mon script:
<?php
require_once("include_path_inc.php");
require_once("jpGraph/src/jpgraph.php");
require_once("jpGraph/src/jpgraph_bar.php");

//Connexion à la base de données
$mysqli = new mysqli("localhost", "root", "", "crl_yali_dk");
if ($mysqli->connect_errno) {
    echo "Echec lors de la connexion à MySQL: (" . $mysqli->connect_errno . ") " . $mysqli->connect_error;
}

//Requête sql
$query ='select  donnees.id_pays, count(donnees.id_pays) as nbre from donnees,pays
     where donnees.id_pays=pays.id_pays and session=1 group by donnees.id_pays';

//Exécution requête
$result = $mysqli->query($query);

//initilisation de l'array
$tontableau = array();

//Traitement du résultat de la requête
while($row = $result->fetch_assoc()){
  $tontableau[] = (float)$row['nbre'];
}

$pays = array('BENIN','BURKINA FASO','CAMEROUN','CAP VERT','COTE D\'IVOIRE','GABON','GUINEE BISSAU','GUINEE EQUATORIALE','GUINEE','MALI','MAURITANIE','NIGER','SOA TOME ET PRINCIPE','SENEGAL','TCHAD','TOGO');

$largeur = 1000;
$hauteur = 200;

// Initialisation du graphique
$graphe = new Graph($largeur, $hauteur);

// Echelle lineaire ('lin') en ordonnee et pas de valeur en abscisse ('text')
// Valeurs min et max seront determinees automatiquement
$graphe->setScale("textlin");

// set major and minor tick positions manually
$graphe->yaxis->SetTickPositions(array(0,2,4,6,8,10), array(15,45,75,105,135));
$graphe->SetBox(false);

//$graph->ygrid->SetColor('gray');
$graphe->ygrid->SetFill(false);
$graphe->xaxis->SetTickLabels($pays);
$graphe->yaxis->HideLine(false);
$graphe->yaxis->HideTicks(false,false);

// Creation de l'histogramme
$histo = new BarPlot($tontableau);

// Ajout de l'histogramme au graphique
$graphe->add($histo);

// Ajout du titre du graphique
$graphe->title->set("Histogramme Par Nationalité");

// Affichage du graphique
$graphe->stroke();

?>
Merci d'avance
1 réponse
-
Salut,
D'après la doc, tu peux définir l'inclinaison des libellés de l'axe via la méthode SetLabelAngle() sur ton objet Axis :
https://jpgraph.net/download/manuals/classref/AxisPrototype.html#_AXISPROTOTYPE_SETLABELANGLE
Bonne journée,