C# aide LiveChart package
Melman
-
Melman -
Melman -
Bonjour, je me tourne vers vous car j'aimerai écrire des données dans un Cartesian Graph du package LiveChart, cependant je n'arrive pas à créé une courbe à l'aide d'une list, petit exemple pour comprendre
Quelque chose dans le genre en tout cas
           cartesianChartCpu.Series.Clear();

            var lineCpu = new LineSeries(){ Title = "Cpu" };
            foreach (var item in cpuRamParses)
                lineCpu.Values = new ChartValues<ObservablePoint>
                {
                    new ObservablePoint(Convert.ToDouble(item.Cpu), Convert.ToDouble(item.HeuresMinutes))
                };
Quelque chose dans le genre en tout cas
Configuration: Windows / Firefox 79.0
11 réponses
-
Il suffit d'adapter un peu
            List<KeyValuePair<DateTime, double>> datas = new List<KeyValuePair<DateTime, double>>
            {
                new KeyValuePair<DateTime, double>(DateTime.Parse("10/08/2020"), 12.5),
                new KeyValuePair<DateTime, double>(DateTime.Parse("11/08/2020"), 15.2),
                new KeyValuePair<DateTime, double>(DateTime.Parse("12/08/2020"), 16.8),

            };

            var lineCpu = new LineSeries(){ Title = "Cpu" };
            lineCpu.Values = new ChartValues<DateTimePoint>();
            foreach (var item in datas)
                lineCpu.Values.Add(new DateTimePoint(item.Key, item.Value));

            cartesianChart1.Series = new SeriesCollection
            {
                lineCpu
            };

            Func<double, string> xFormatter = val => new DateTime((long)val).ToString("dd/MM/yyyy");

            cartesianChart1.AxisX = new AxesCollection
            {
                new Axis{Title = "Date", LabelFormatter = xFormatter}
            };
-
-
Je vais le télécharger et essayer, mais à brule pour point, Values ne serait ce pas une collection et donc il faudrait y faire un Add
lineCpu.Values.Add(new ChartValues<ObservablePoint> //......)
-
-
Vous n’avez pas trouvé la réponse que vous recherchez ?
Posez votre question -
Ha oui pardon, j'avais mal lu ton code....
En l'état à chaque item tu crées une nouvelle collection de 1 item.
Il faut initialiser la collection, puis la remplirvar lineCpu = new LineSeries(){ Title = "Cpu" }; lineCpu.Values = new ChartValues<ObservablePoint>(); foreach (var item in cpuRamParses) lineCpu.Values.Add(new ObservablePoint(Convert.ToDouble(item.Cpu), Convert.ToDouble(item.HeuresMinutes)));
-
-
J'ai réussi à tout mettre dans ma list, mais au moment d'afficher rien ne ce passe j'ai essayer ceci :
var lineCpu = new LineSeries(){ Title = "Cpu" };
            lineCpu.Values = new ChartValues<ObservablePoint>();
            foreach (var item in cpuRamParses)
                lineCpu.Values.Add(new ObservablePoint(Convert.ToDouble(item.Cpu), item.date.ToOADate()));

            cartesianChartCpu.Series = new SeriesCollection(new LineSeries(lineCpu));
et:
var lineCpu = new LineSeries(){ Title = "Cpu" };
            lineCpu.Values = new ChartValues<ObservablePoint>();
            foreach (var item in cpuRamParses)
                lineCpu.Values.Add(new ObservablePoint(Convert.ToDouble(item.Cpu), item.date.ToOADate()));

            cartesianChartCpu.Series = new SeriesCollection(lineCpu);
Mais aucun affichage d'effectué
-
-
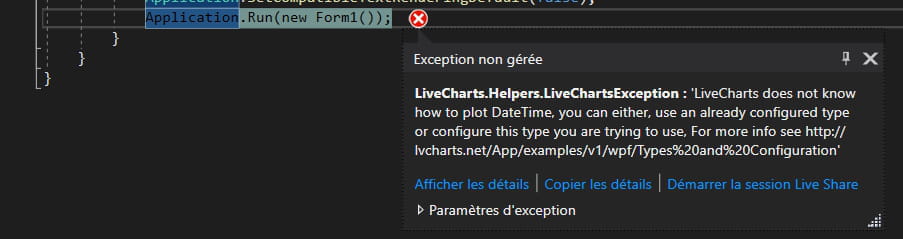
J'ai finalement trouvé quelque chose de fonctionnel je suis juste bloqué sur le fait que mon axe X ne sois pas au format date time...
voici mon code
public Form1()
        {
            InitializeComponent();
        }

        private List<CpuRamParse> cpuRamParses = new List<CpuRamParse>();

        public void Parsing(string chemin)
        {
            IEnumerable<string> lines = File.ReadAllLines(chemin);
            foreach (string item in lines)
            {
                DateTime fileCreationTime = Convert.ToDateTime(File.GetCreationTime(file).ToShortDateString());
                CpuRamParse leLog = CpuRamParse.Trie(item, fileCreationTime);
                if (leLog != null)
                    cpuRamParses.Add(leLog);
            }
        }

        private void button1_Click(object sender, EventArgs e)
        {
            Parsing(file);
            var xvals = new List<DateTime>();
            var yvalsCpu = new List<double>();
            var yvalsRam = new List<double>();

            var dayConfig = Mappers.Xy<DateModel>()
                .X(dayModel => (double)dayModel.DateTime.Ticks / TimeSpan.FromHours(1).Ticks)
                .Y(dayModel => dayModel.Value);

            foreach (var item in cpuRamParses)
            {
                xvals.Add(item.date);
                yvalsCpu.Add(Convert.ToDouble(item.Cpu));
                yvalsRam.Add(Convert.ToDouble(item.Ram));
            }

            Cpu = new LineSeries
            {
                Title = "Cpu",
                Values = yvalsCpu.AsChartValues().AsGearedValues().WithQuality(Quality.Medium),
                Fill = Brushes.Transparent,
                PointGeometry = DefaultGeometries.Diamond,
                PointGeometrySize = 9,
                StrokeThickness = 1
            };

            Ram = new LineSeries
            {
                Title = "Ram",
                Values = yvalsRam.AsChartValues().AsGearedValues().WithQuality(Quality.Medium),
                Fill = Brushes.Transparent,
                PointGeometry = DefaultGeometries.Diamond,
                PointGeometrySize = 9,
                StrokeThickness = 1
            };

            cartesianChartCpu.Series = new SeriesCollection
            {
                Cpu,
                Ram
            };

            cartesianChartCpu.DisableAnimations = true;
            cartesianChartCpu.Hoverable = false;
            cartesianChartCpu.AnimationsSpeed = TimeSpan.FromMilliseconds(150);
        }

        public LineSeries Cpu { get; set; }
        public LineSeries Ram { get; set; }

        public class DateModel
        {
            public DateTime DateTime { get; set; }
            public double Value { get; set; }
        }

        private void CpuSeries_CheckedChanged(object sender, EventArgs e)
        {
            if (Cpu != null)
            {
                Cpu.Visibility = Cpu.Visibility == Visibility.Visible
                ? Visibility.Hidden
                : Visibility.Visible;
            }
            else
                _ = chbCpuSeries.Checked == true;
        }

        private void checkBox1_CheckedChanged(object sender, EventArgs e)
        {
            if (Ram != null)
            {
                Ram.Visibility = Ram.Visibility == Visibility.Visible
                ? Visibility.Hidden
                : Visibility.Visible;
            }
            else
                _ = chbRamSeries.Checked == true;
        }

        private void button4_Click(object sender, EventArgs e)
        {
            cartesianChartCpu.AxisX[0].MinValue = 0;
            cartesianChartCpu.AxisX[0].MaxValue = 25;
        }

        private void button3_Click(object sender, EventArgs e)
        {
            cartesianChartCpu.AxisX[0].MinValue += 25;
            cartesianChartCpu.AxisX[0].MaxValue += 25;
        }

        private void button2_Click(object sender, EventArgs e)
        {
            cartesianChartCpu.AxisX[0].MinValue -= 25;
            cartesianChartCpu.AxisX[0].MaxValue -= 25;
        }
-
-
-
Parce que chez moi, en faisait bêtement comme dans l'exemple ça marche
using LiveCharts;
using LiveCharts.Defaults;
using LiveCharts.Wpf;
using System;
using System.Collections.Generic;
using System.ComponentModel;
using System.Windows;

namespace Test_WPF
{
    /// <summary>
    /// Logique d'interaction pour MainWindow.xaml
    /// </summary>
    public partial class MainWindow : Window, INotifyPropertyChanged
    {

        public MainWindow()
        {
            InitializeComponent();

            List<KeyValuePair<DateTime, double>> datas = new List<KeyValuePair<DateTime, double>>
            {
                new KeyValuePair<DateTime, double>(DateTime.Parse("10/08/2020"), 12.5),
                new KeyValuePair<DateTime, double>(DateTime.Parse("11/08/2020"), 15.2),
                new KeyValuePair<DateTime, double>(DateTime.Parse("12/08/2020"), 16.8),

            };

            var lineCpu = new LineSeries(){ Title = "Cpu" };
            lineCpu.Values = new ChartValues<DateTimePoint>();
            foreach (var item in datas)
                lineCpu.Values.Add(new DateTimePoint(item.Key, item.Value));

            Series = new SeriesCollection
            {
                lineCpu
            };

            XFormatter = val => new DateTime((long)val).ToString("dd/MM/yyyy");

            DataContext = this;
        }

        private SeriesCollection series;
        /// <summary>
        /// Séries du graph
        /// </summary>
        public SeriesCollection Series
        {
            get { return series; }
            set
            {
                if (series != value)
                {
                    series = value;
                    GenerePropertyChanged("Series");
                }
            }
        }

        private Func<double,string> xFormatter;
        /// <summary>
        /// Format de l'axe X
        /// </summary>
        public Func<double,string> XFormatter
        {
            get { return xFormatter; }
            set
            {
                if (xFormatter != value)
                {
                    xFormatter = value;
                    GenerePropertyChanged("XFormatter");
                }
            }
        }


        #region INotifyPropertyChanged
        public event PropertyChangedEventHandler PropertyChanged;

        private void GenerePropertyChanged(string Propriete)
        {
            if (this.PropertyChanged != null) PropertyChanged(this, new PropertyChangedEventArgs(Propriete));
        }

        #endregion
    }

}
<Window x:Class="Test_WPF.MainWindow" xmlns="http://schemas.microsoft.com/winfx/2006/xaml/presentation" xmlns:x="http://schemas.microsoft.com/winfx/2006/xaml" xmlns:lvc="clr-namespace:LiveCharts.Wpf;assembly=LiveCharts.Wpf" Title="MainWindow" Height="719" Width="694"> <Grid > <lvc:CartesianChart Series="{Binding Series}"> <lvc:CartesianChart.AxisX> <lvc:Axis Title="Dates" LabelFormatter="{Binding XFormatter}"></lvc:Axis> </lvc:CartesianChart.AxisX> </lvc:CartesianChart> </Grid> </Window>

-
-
J'ai réussi grâce à ton aide, Merci ! ça ma aussi permis d'apprendre le "KeyValuePair" ^^ !
je post le code ici en espérant que cela serve un jour, je précise que ce code fonctionne pour les windforms et non les wpf
 InitializeComponent();
            string chemin = @"votreChemin";
            IEnumerable<string> lines = File.ReadAllLines(chemin);
            foreach (string item in lines)
            {
                DateTime fileCreationTime = Convert.ToDateTime(File.GetCreationTime(chemin).ToShortDateString());
                CpuRamParse leLog = CpuRamParse.Trie(item);
                if (leLog != null)
                    cpuRamParses.Add(leLog);
            }

            List<KeyValuePair<DateTime, double>> datas = new List<KeyValuePair<DateTime, double>>();
            foreach (var item in cpuRamParses)
                datas.Insert(0, new KeyValuePair<DateTime, double>(item.date, Convert.ToDouble(item.Cpu)));

            var lineCpu = new LineSeries(){ Title = "Cpu" };
            lineCpu.Values = new ChartValues<DateTimePoint>();
            foreach (KeyValuePair<DateTime, double> item in datas)
                lineCpu.Values.Add(new DateTimePoint(item.Key, item.Value));

            cartesianChart1.Series = new SeriesCollection
            {
                lineCpu
            };

            Func<double, string> xFormatter = val => new DateTime((long)val).ToString("dd/MM/yyyy HH:mm");

            cartesianChart1.AxisX = new AxesCollection
            {
                new Axis{Title = "Date", LabelFormatter = xFormatter}
            };