
Decimal separator issue when copying/pasting
Cddnh69
Posted messages
2
Status
Member
-
Cddnh69 Posted messages 2 Status Member -
Cddnh69 Posted messages 2 Status Member -
Hello,
I recently started using PowerPoint 2016.
My Windows, PowerPoint, and Excel regional settings are in English (thousands separator ",", decimal separator ".").
When I create a chart in Excel 2016 (numbers in "number" format), the y-axis displays as shown in the image (see Image 1). My data is in the format of 22.6, 31.5, etc.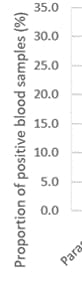
So far, no problem.
For a presentation, I need to paste this chart into PowerPoint.
And then, surprise, when I copy-paste, the decimals on the axis are systematically divided by 10 (see image 2).
As a result, the displayed data is incorrect by a factor of 10!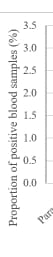
I tried modifying it by right-clicking on the axis, selecting "format axis," "axis options," "number," changing the type and format code, but I couldn't find anything satisfying...
If anyone has any ideas...
Thank you in advance,
Cédric
Related links:
- create a PDF from a PowerPoint WITH comments
- How to keep hyperlinks from PowerPoint when converting to PDF?
- image not displaying in a PowerPoint presentation
- Animation issues in a PowerPoint 2016 presentation
- Slideshow without sound when transferring to another computer
- insert an image slideshow in a PPT
Thank you for this response, which is indeed the one I usually use.
However, the graphs often need to be reworked during presentations at official conferences, and the quality of the image copy in .jpg is not great.
I tried again; while my graph is well configured in Excel, this time the graph sticks in PowerPoint with the axis labels as ",", meaning 22.6, 31.5... (French version thus), but it's impossible to change this to dots...