Complicated Gantt chart
SolvedI’m having trouble creating a pivot table because my data is poorly structured.
Basically, I will have in a column:
- A a person
- B their name
- C their status
- E whether they entered or left, etc. in FEB 2019
- G whether they entered or left, etc. in MAR 2019
- I whether they entered or left, etc. in APR 2019
- ETC.
And what I want is to create a pivot table that in rows gives:
- My statuses
- the info on entry/exit, etc. from columns E, G, I, ETC.
And have as values the count of times I entered, left, etc., but by month so I can compare them.
But I can’t; it always shows the same data. I’m attaching the file so you can probably understand better than with my explanations
https://cijoint.org/r/58FguRCy#3UzOaBoKO0yD36IBT4fEg99UtXm/WaSEJHWjZH2+PXc=
Thanks for your help
13 answers
-
Hello,
Is this the kind of result?
With Power Query, this is easily achievable (if you indeed have Excel version >= 2016)-
Hello, Thank you very much for your feedback and help. Actually, for now I have this in the database:
But what I want is to create a pivot table with a base that allows itPersonne Nom Statut févr-19 mars-19 1 DUPONT PH Entrée Entrée 2 MARTIN PC Présent Sortie 3 DURAND PH Entrée Présent
But to do that I must redo my base but I don’t know exactly how to do it. I don’t know if it’s clearer now? Thank you very much for your help.Statut Situation oct-19 nov-19 déc-19 janv-20 PH Entrée 15 8 12 10 PH Sortie 7 11 9 14 PH Présent 350 347 350 346 PH Baisse QTT 20 8 0 4 PH Augment QTT 16 25 12 8 PC Entrée 4 6 3 5 PC Sortie 2 3 5 4 PC Présent 80 83 81 82
-
-
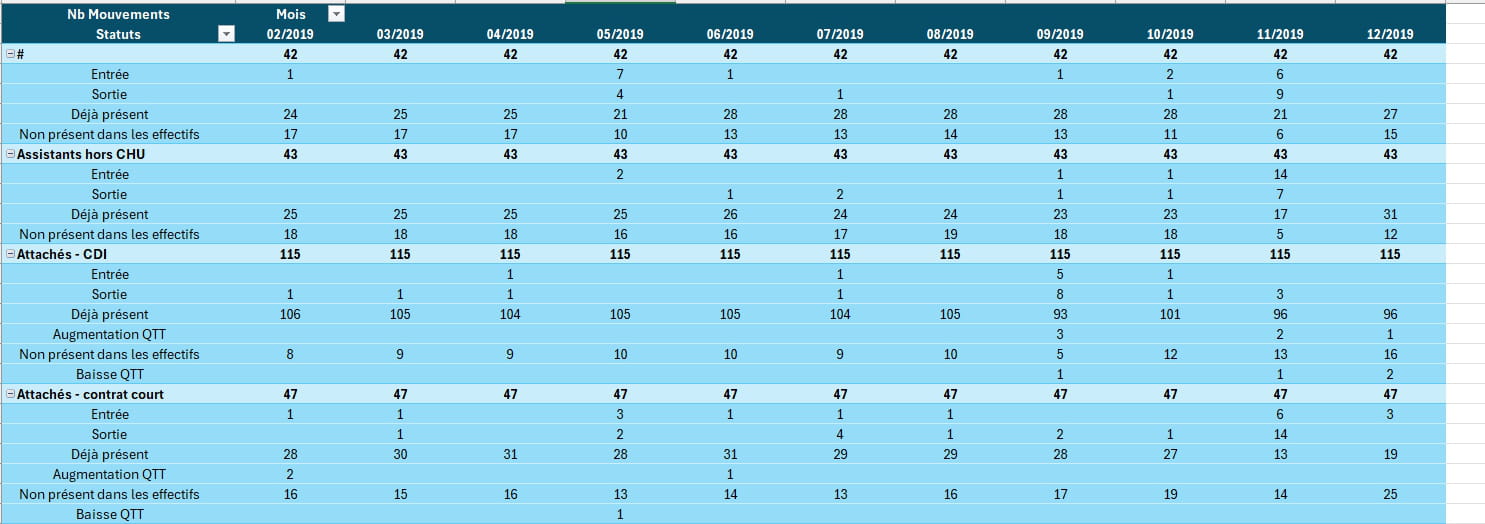
Re-,
What could this look like?
-
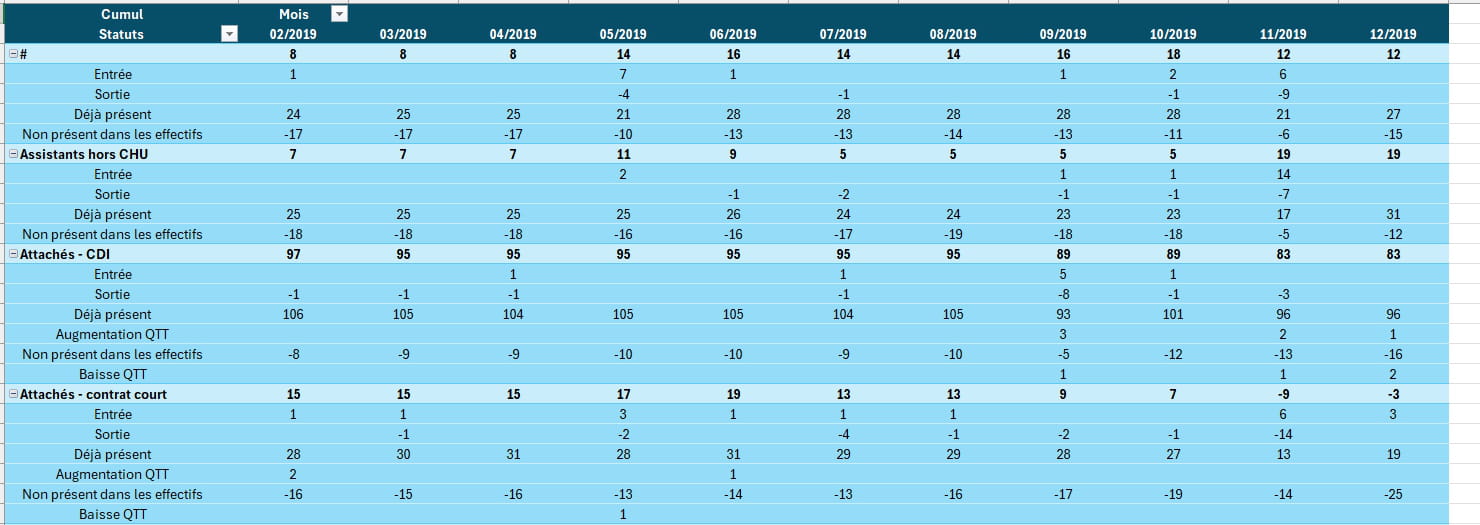
RE-,
Or rather this?
-
-
@Jerome_aaaaarh
I assign -1 if "Sortie" or "non présent", and +1 otherwise
But we can end up with negative totals (Attached: short-term contracts, December 2019) for example
-
@cousinhub29
Oh yes, it's good like that too :)
-
-
Ok, so we’re going to use the solution from the post <3>
But before, a few clarifications are necessary.
I think I notice that this data comes from an "Access" database.
Is the tab name still the same? (or what name is given to the tab?)
Is there only one tab?
Have you tried importing this database via Power Query? (in which case, you would only need to transform directly from that database)
Re-reading you, with these precisions
-
Thank you very much.
It indeed comes from extracting from a BI base, but I wrote a formula to compare m-1 and m and obtain the Entries/Exits columns.
Yes, the sheet name is the same but I didn’t perform the extraction and, above all, I added data manually. In the base extraction there were several tabs but I removed them (useless for me).
Thank you very much,
-
-
Ok,
In the attached file, in the "Param" tab
- You enter the path and file name in cell A2
- You enter the tab name in cell A5
And in the "TCD" tab, right-click inside the PivotTable, then "Refresh"
If you get an error message, you need to configure your Excel application (once and for all) by following the instructions in the "Read Me" tab
-
-
@Jerome_aaaaarh
The file name seems incorrect to me (it should end with xlsb or xlsx or...).
Rename it to "Essai.xls?" (replace the question mark with the actual format—the one you had ended with xlsb).
-
-
Hello,
I stuck with my idea...
Watch Version 4: .
I will rename the first two columns to "Matricule" and "Statut", then apply the same processing.
Basically about forty seconds (processing over 200,000 rows, since I pivot all of the last 12 rows), this is to be able to shift by one month at a time (roughly, it's like your idea, but instead of shifting column by column, I do it row by row).
Make sure to fill in A2 with the path (subdirectory) of your files, and modify column G to list the columns as we discussed last night.
Have a good day
-
Re-,
Try putting only a single file in the subdirectory.
And an Alpha-Mike procedure from the famous Doctor OnOff (an Stop/Go, in French)
-
Can you attach the 2025 file, removing the first and last names (I don't need them)?
If you don’t want to put it in public too much, you can send me the link in a private message, then delete the file after the first download, as cijoint's site suggests
I'm going to be away for a bit, see you later
-
Ok,
Given the origin of the problems
There was a named zone that was integrated into the calculations, and empty lines.
These two issues have been corrected.
To check (with always the subdirectory in A2)
-
-
@Jerome_aaaaarhNickel,
I told you we’d have it...
Doesn’t that take too long?
If you think it’s resolved, you can click the "Resolved" button in the very first post (the one where you asked the initial question). -
@cousinhub29
A very big thank you again ????
It runs about 5 minutes, it’s perfect ????
It works, I’ll do it ????
-
@cousinhub29
I can’t find the “resolved” button, where is it please?
-
-
See, this is the question I asked yesterday

And the button is in my first post
-
It’s indeed xlsb
But it still doesn’t work. Maybe because I put an underscore between the path and the file name _Essai.xlsb
C:\Users\4121759\Desktop\Entrée sortie par mois par année\Nouveau dossier_Essai.xlsb

-
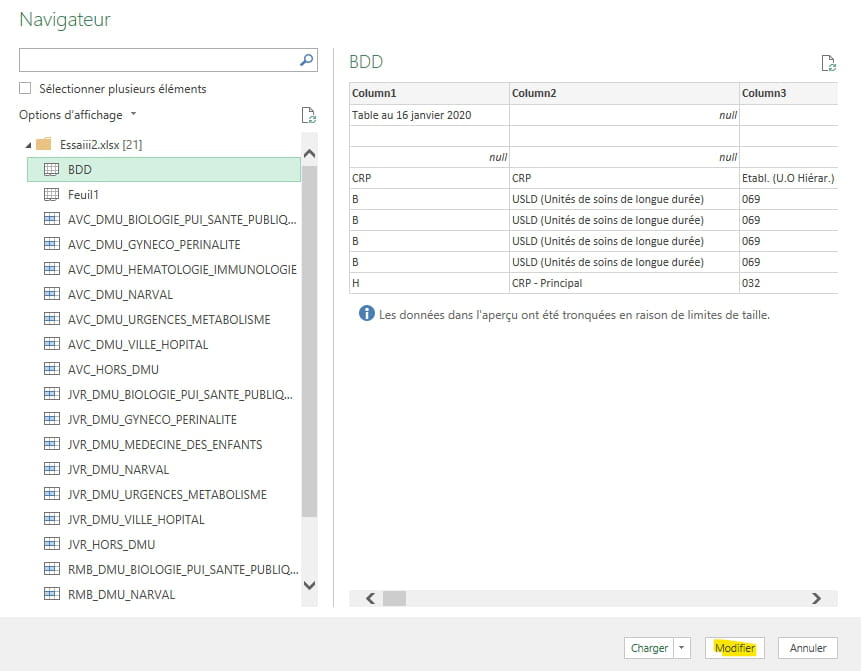
Ok, we’re going to do a trick to properly retrieve the right file
In Excel, you click on "Data/From a file/From Excel Workbook"
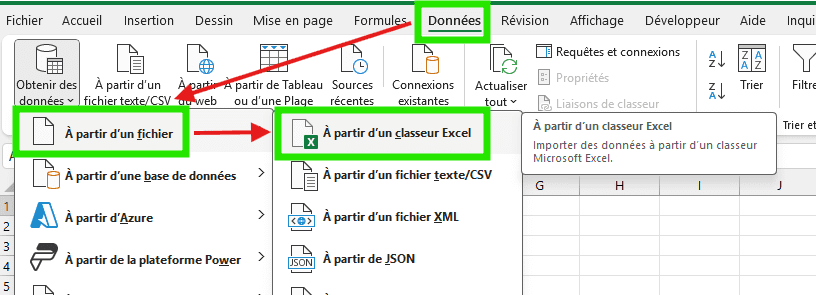
You search for your file, then the tab, and "Transform Data"
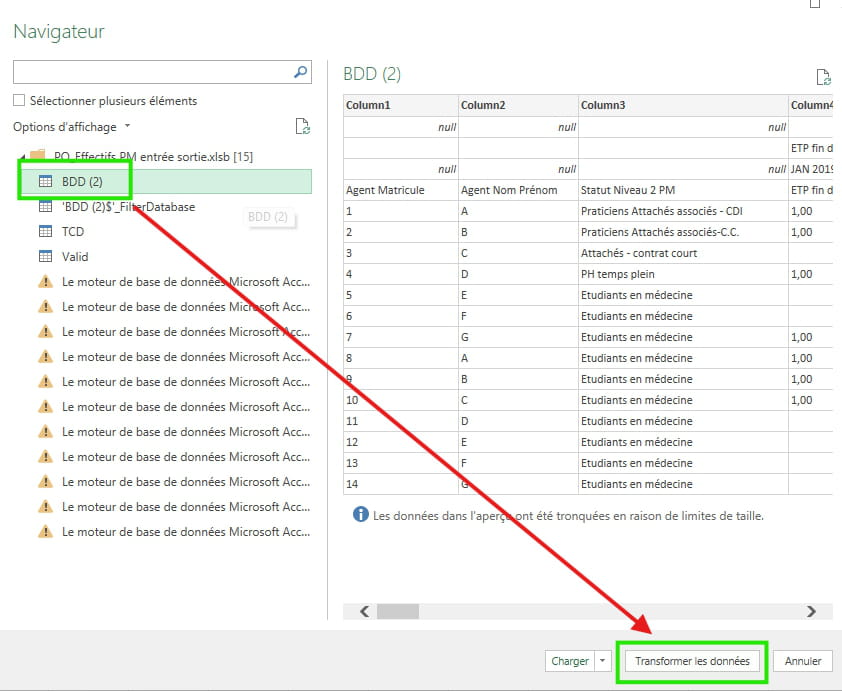
And in the editor, step "Source", you retrieve the path and the name:
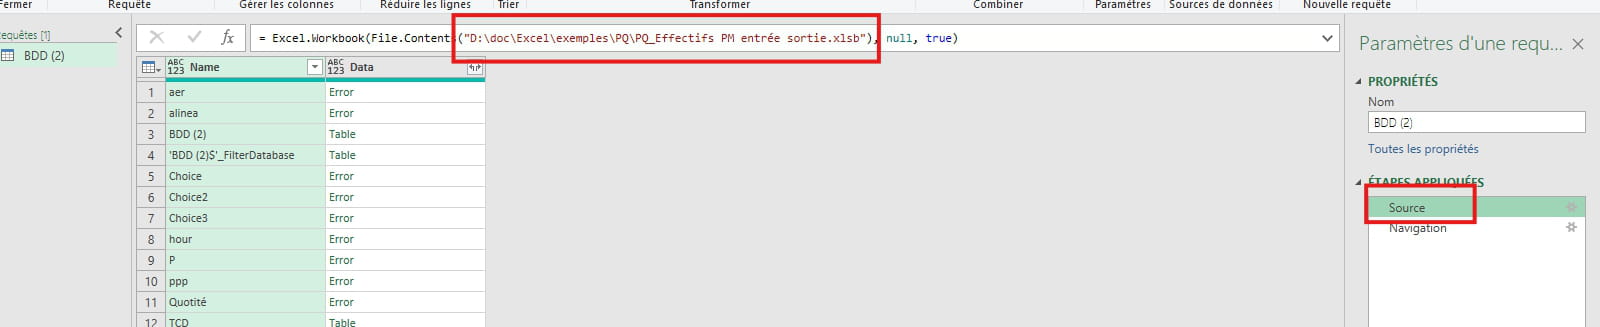
And you paste this info into cell A2 (without the quotes)
-
-
@Jerome_aaaaarh
Re-,
I don't know why (well, yes, but...), but according to the versions, PQ doesn't like xlsb files (at work, I had Excel 2016, and I couldn't read these files)
At home, xl2024, no problem
Open the xlsb file, and save it in xlsx or xlsm format (note, you must not simply change the extension, but use "Save As...")
And try again with this new format
-
-
@Jerome_aaaaarh
That’s good too (it depends on the version of Excel)
Click on it, then retrieve the full name in the "Source" step
-
-
Same message every time
Afterwards it's not a problem otherwise ;)
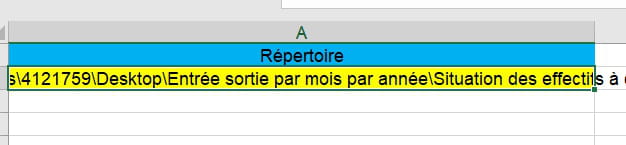
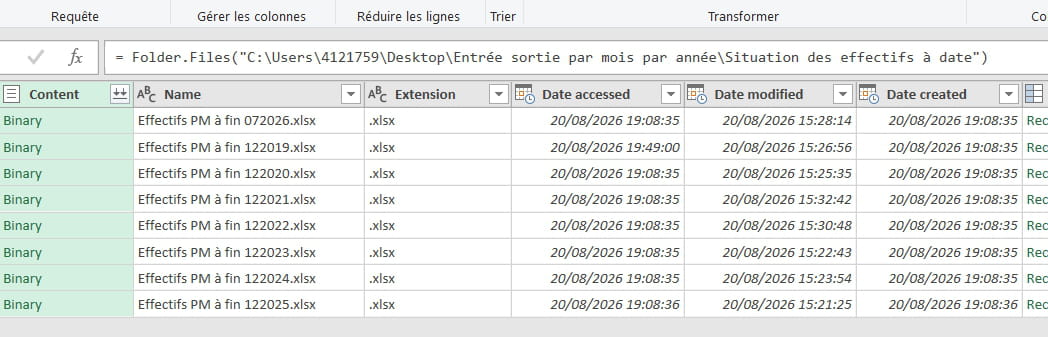
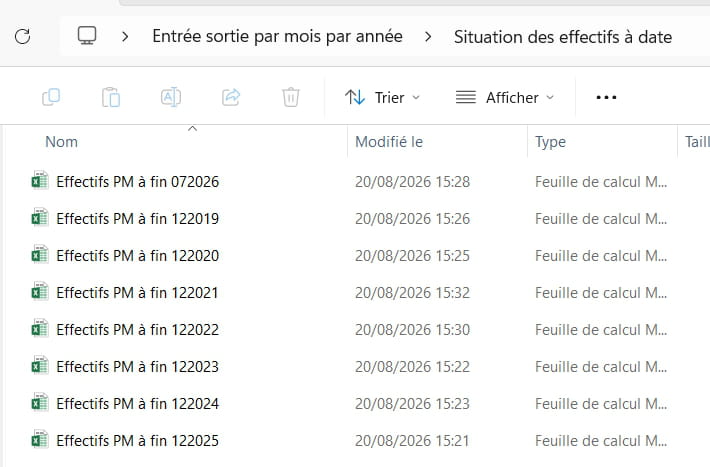
-
-
-
@Jerome_aaaaarh
Hello,
If you want, we can continue.
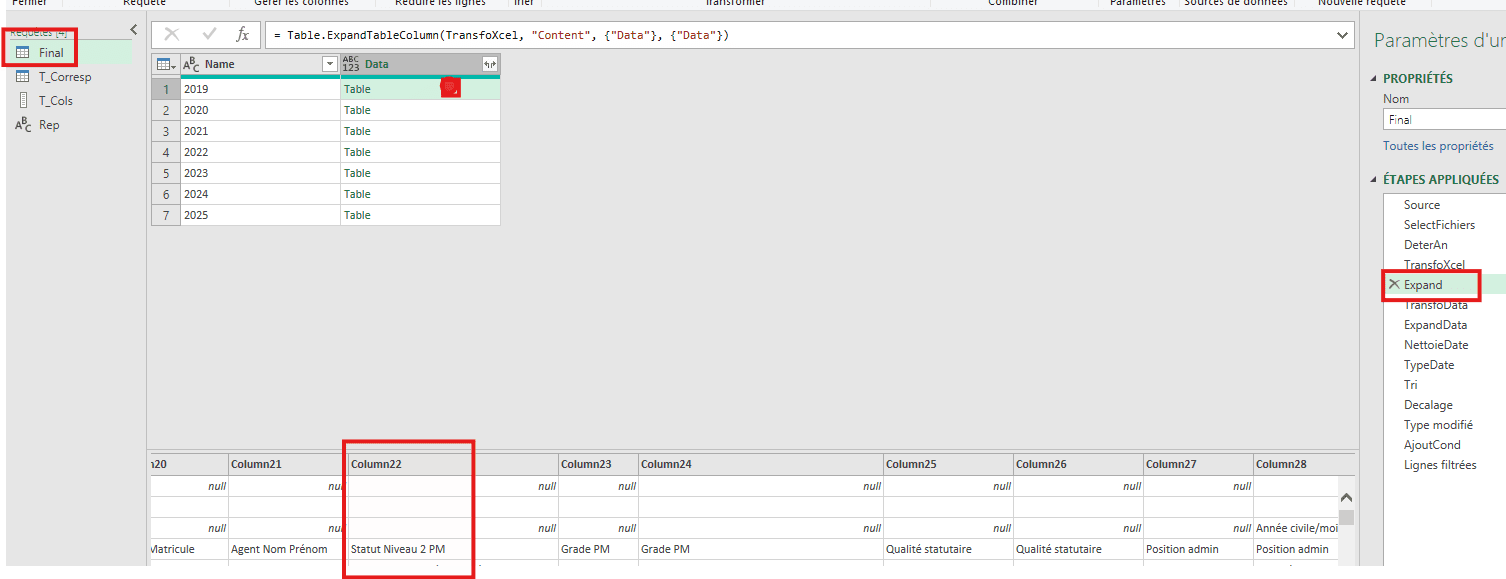
Could you take a screenshot in the PQ editor at the "Expand" step?
In the Table, click on the red dot, in the first row.
At the bottom, there will be the data corresponding to this table, which you can enlarge upward by placing your cursor on the separator line, then clicking to move this separator upward.You then move to the right, and you verify that in column 22 there is indeed the "Status Level 2 PM" in row 4, and "Agent badge" in column 20
-
@cousinhub29Hi,
Thank you very much, I don't have the table at the bottom and I have an attention on the final -
@Jerome_aaaaarh
Re-,
Why do you have duplicate files?
Can you take a screenshot of all the steps up to that point?
And also, especially, the table as I showed you
Meanwhile, you can check in one of the files that these are indeed columns 20,22, then 29 to 40 (i.e. T, V, and from AC to AN which contain the necessary columns, and that the headers are indeed on row 4

-
-
Hi,
Thank you very much :)
It works I think, thank you very much, but I think my PC is too weak... if the following message could mean that?